📊 Critical Statistics: Complete Learning Hub
General Education • 50+ Concepts • Applications • Ethics, IRB, R • 200‑Question Quiz • Interactive Big Picture with Hand Calculations
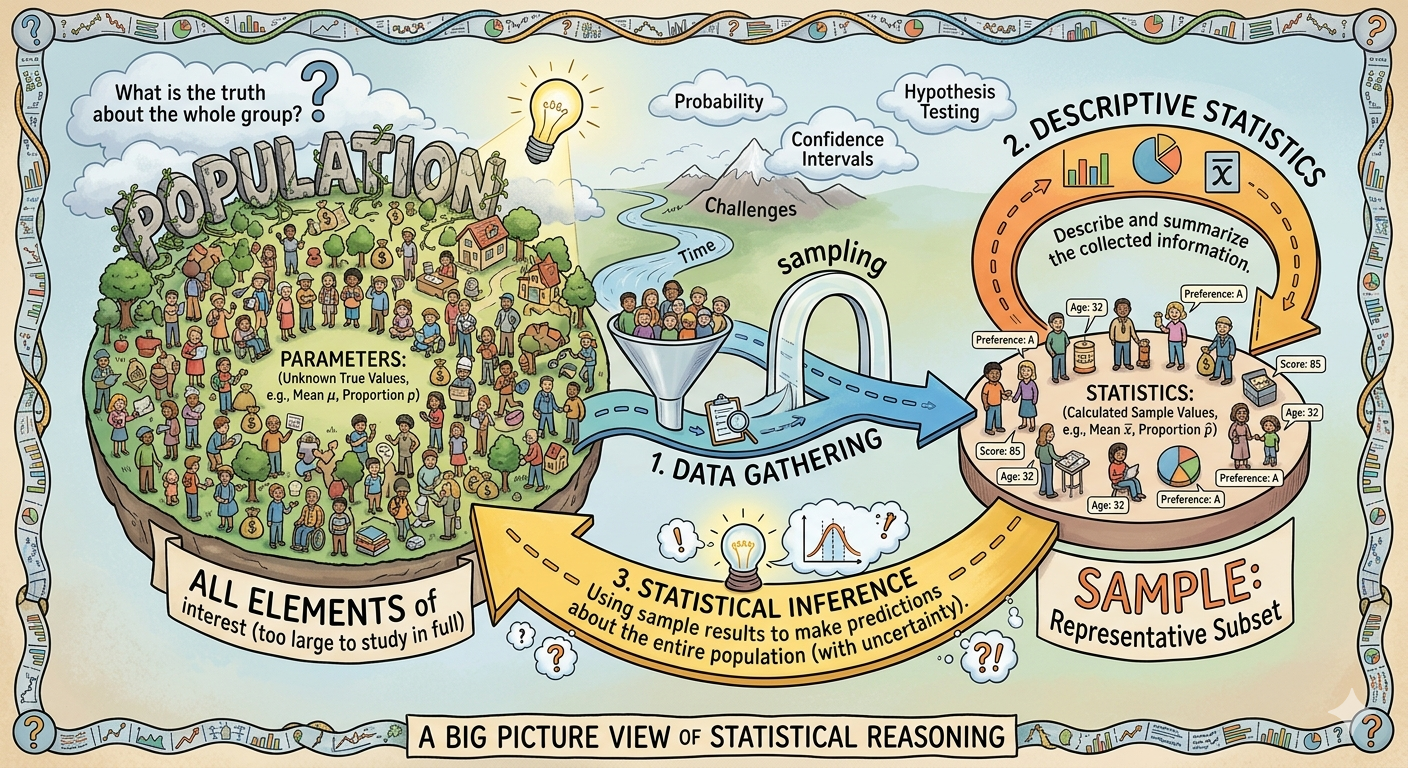
📈 The Big Picture of Statistics (Clickable Concepts)
Click any concept card to see a detailed explanation with real-world hand-calculation examples
📐 Key 50+ Concepts (Dropdown)
🌐 Applications of Statistics (Dropdown)
📦 Statistics with R: Code Examples
💻 How to run this code online (free):
- Go to https://www.mycompiler.io/new/r
- Delete all the example code that appears in the editor
- Click any button below to see the R code, then copy and paste it
- Click the "Run" button to see the output
🤖 Using AI (ChatGPT) to Learn Statistics
- Ask: "Explain p-value like I'm 10 years old"
- "Walk me through the 5 steps of hypothesis testing"
- "Show me R code for a histogram with mean line"
- "Explain Central Limit Theorem with a pizza analogy"
- "Help me understand Type I vs Type II error with court case example"
• "Explain what a p-value means in plain English with a coin-flipping example"
• "Walk me through the 5 steps of hypothesis testing for a proportion"
• "What's the difference between Type I and Type II error? Give real-world examples"
• "Show me R code to create a histogram and add a vertical line at the mean"
• "Help me understand R-squared: what does 0.80 mean in a real study?"
⚠️ Tip: Always verify AI-generated answers with trusted sources. Use AI as a study partner, not a replacement for learning.
📋 Study Designs in Statistics
📌 What is Statistics & Course Resources
Statistics is the science of collecting, organizing, analyzing, interpreting, and presenting data. It helps us make sense of numbers and make informed decisions under uncertainty. This field is foundational across all disciplines, from medicine to marketing, and from social sciences to engineering.
📖 Course Resources:
⚖️ Ethics & IRB: Institutional Review Boards (IRBs) protect human subjects in research. Core principles: informed consent, confidentiality, minimizing harm, avoiding p-hacking, and pre-registration of studies to reduce bias.